Introduction and Model Recap
It’s been a long semester, but we finally know the outcome of the 2020 presidential election. So how did my final prediction stack up against the actual results? To recap, I created a two-sided, unpooled ensemble model that predicted a separate vote share for both the Democratic and Republican candidate in each state. The predicted vote share for the Democratic or Republican candidate in each state was calculated based on the results of two equally weighted linear regressions, with the first regression using only polling data (using only polls conducted 2 weeks before the election or sooner) to predict vote share. The second regression used the vote share from the previous election, the change in the state’s white population since the previous election, and whether or not the candidate’s party has incumbency status to predict vote share. Ultimately, I predicted that Democrat Joe Biden would win 279 electoral votes to Republican Donald Trump’s 259, and the results of the actual election were not too far off, with Biden winning 306 electoral votes to Trump’s 232. Take a look below at the actual electoral vote totals versus my predicted totals:
| Actual EV Totals | Predicted EV Totals |
|---|---|
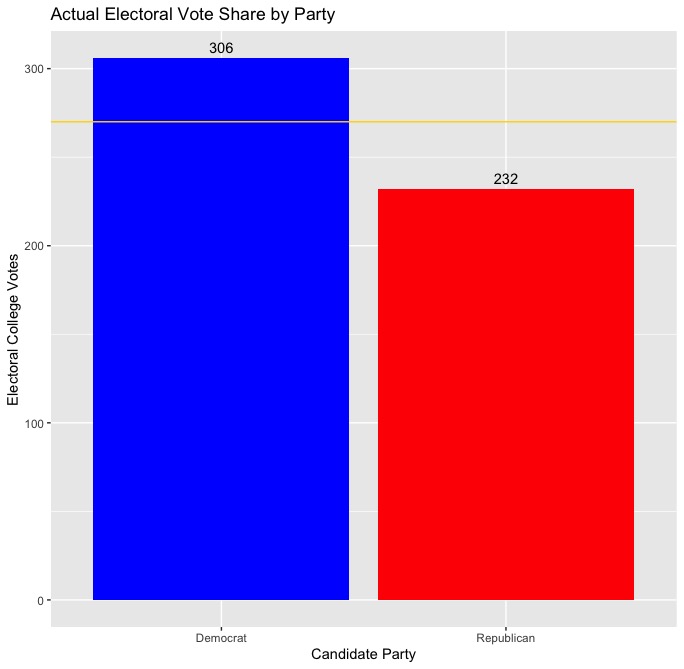 |
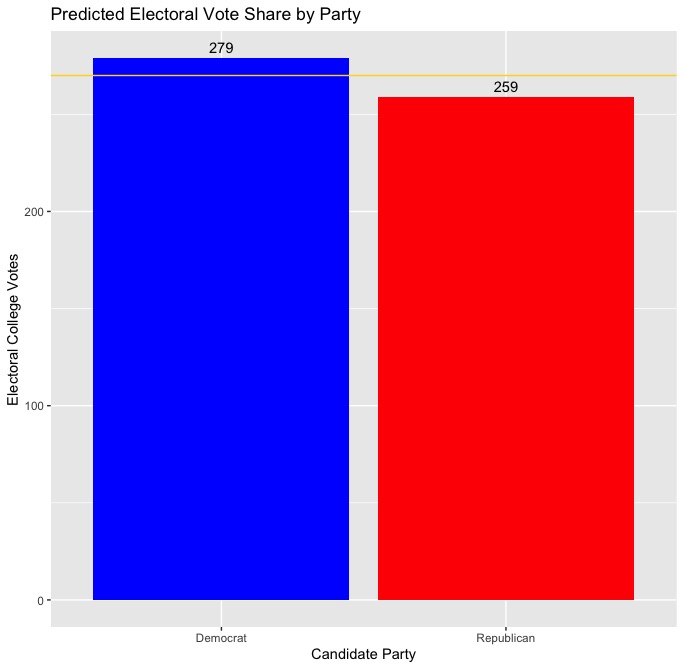 |
In a winner-take-all system like the electoral college, where the winner of each state recieves all of its electoral votes (excluding Maine and Nebraska, the two states that can split their electoral votes), being able to predict the winner of each state is key to correctly predicting the winner of the presidency. Using my model, I was able to correctly predict the winner of every state aside from the states of Arizona and Georgia. Even though I predicted that Trump would win both Georgia and Arizona by a little over 6 percentage points, it seems as though Biden will ultimately win both by less than one percentage point each. While it is probably fair to say that my model did a good job predicting the winner in each state and even successfully predicted that Joe Biden would win the presidential election, it’s worth investigating the error in my prediction and any trends within the logic of my model that contributed to incorrect predictions in Georgia and Florida in order to understand how to create a stronger model for future elections.
| Actual Map | Predicted Map |
|---|---|
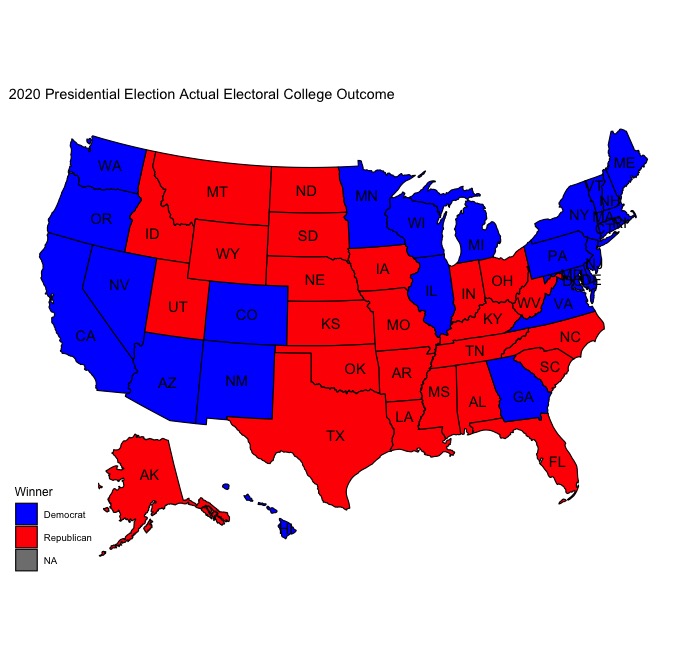 |
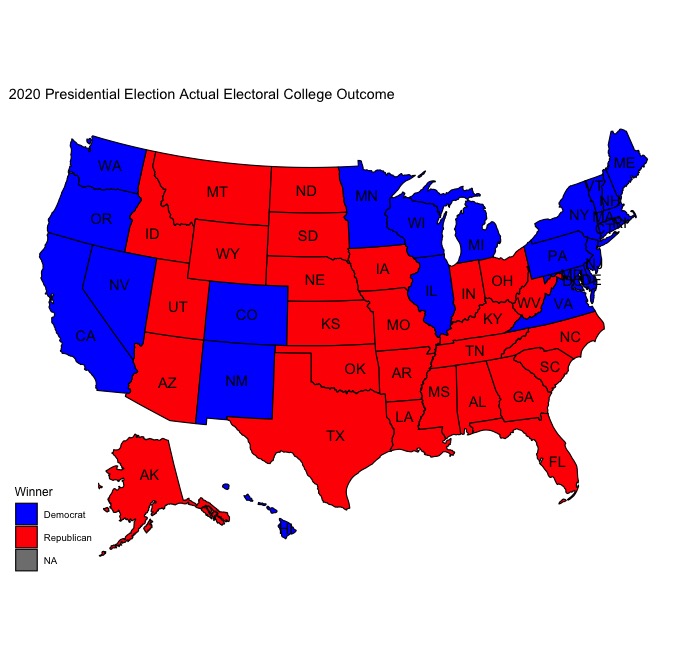 |
Model Error
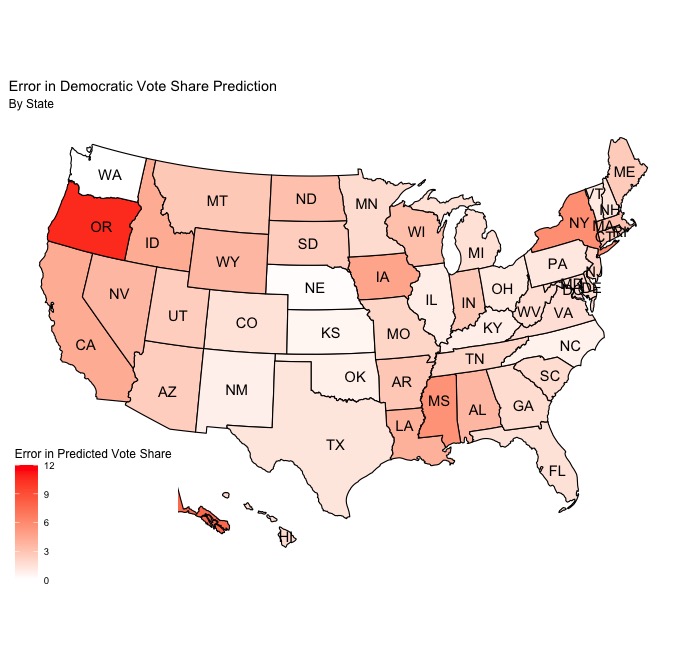
Because I used a two-sided model that produced a separate Democratic and Republican vote share prediction for each state, I decided to plot the error in my predictions in each state for both parties in order to better understand any clear trends in the error.
| Democratic Error | Republican Error |
|---|---|
 |
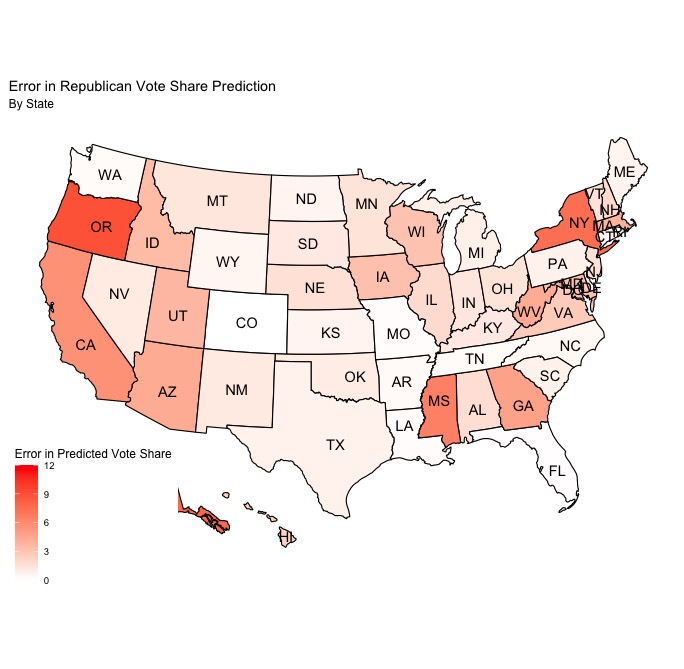 |
After considering these maps side-by-side, there are definitely some visually apparent trends in the errors that are worth discussing. For starters, it seems as though the Republican vote share predictions were, on average, slightly more correct than the Democratic vote share predictions. However, it doesn’t seem to be a very large difference, and it’s unlikely that a slight imbalance in the accuracy of the Democratic and Republican predictions was a major source of error in the model. Additionally, the states with the greatest and least error seem to be the same for both the Democratic and Republican predictions. Both New York and Oregon seem to be the states with the greatest error for both parties, and Washington state seems to be the state with the least error. It’s also worth noting that it appears as though the average error in battleground states is lower than the average error in non-battleground states for both Democratic and Republican predicted vote shares. Because of the historical trend of very small win margins in these states, this is a very good thing for my model, as these states ultimately ended up deciding the outcome of the election and thus accuracy in predicting them is key.
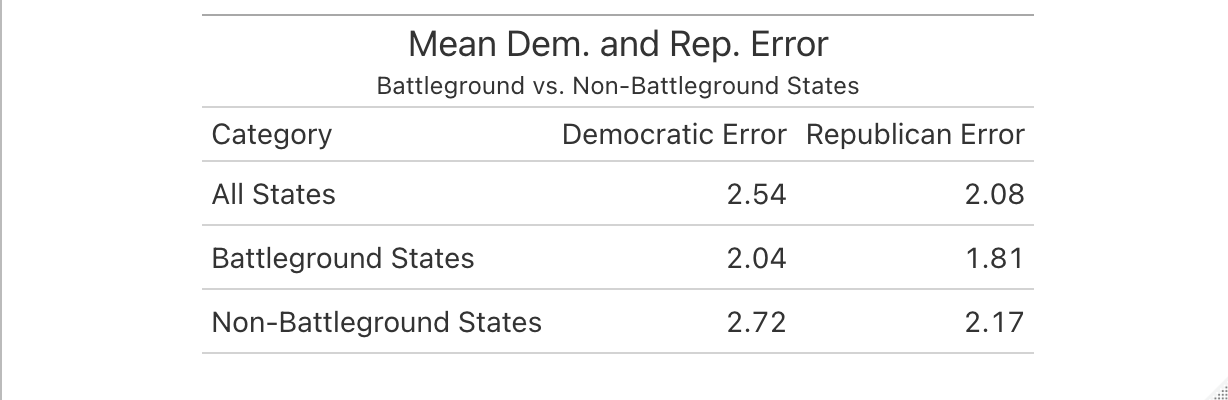
The table helps to precisely quantify many of the trends apparent in the map. On average, the predicted Republican vote shares were a little more accurate, but only by less than half a percentage point. Additionally, error was universally lower for the predicted vote shares in battleground states, but still only by less than a percentage point as compared to non-battleground states. Relatively speaking, there are very few states overall that will have margins of victory that are less than 2 percentage points (basically all are battleground states), but based on the maps and this table it seems as though focusing on those states will tell me the most about where my model went wrong and why.
What Happened?
While it is clear that my model was successful in many important ways (predicting the overall winner, predicting the correct winner in 48/50 states, having relatively low error in predicting the Democratic and Republican vote shares in each state), the incorrect predictions for the states of Arizona and Georgia merit careful examination of my model’s flaws. First, let’s take a look at my predicted vote shares for battleground states alongside the actual vote shares for both candidates in ascending order based on the magnitude of error (note that state where the outcomes were correctly predicted are in green, and incorrect predictions are in red):
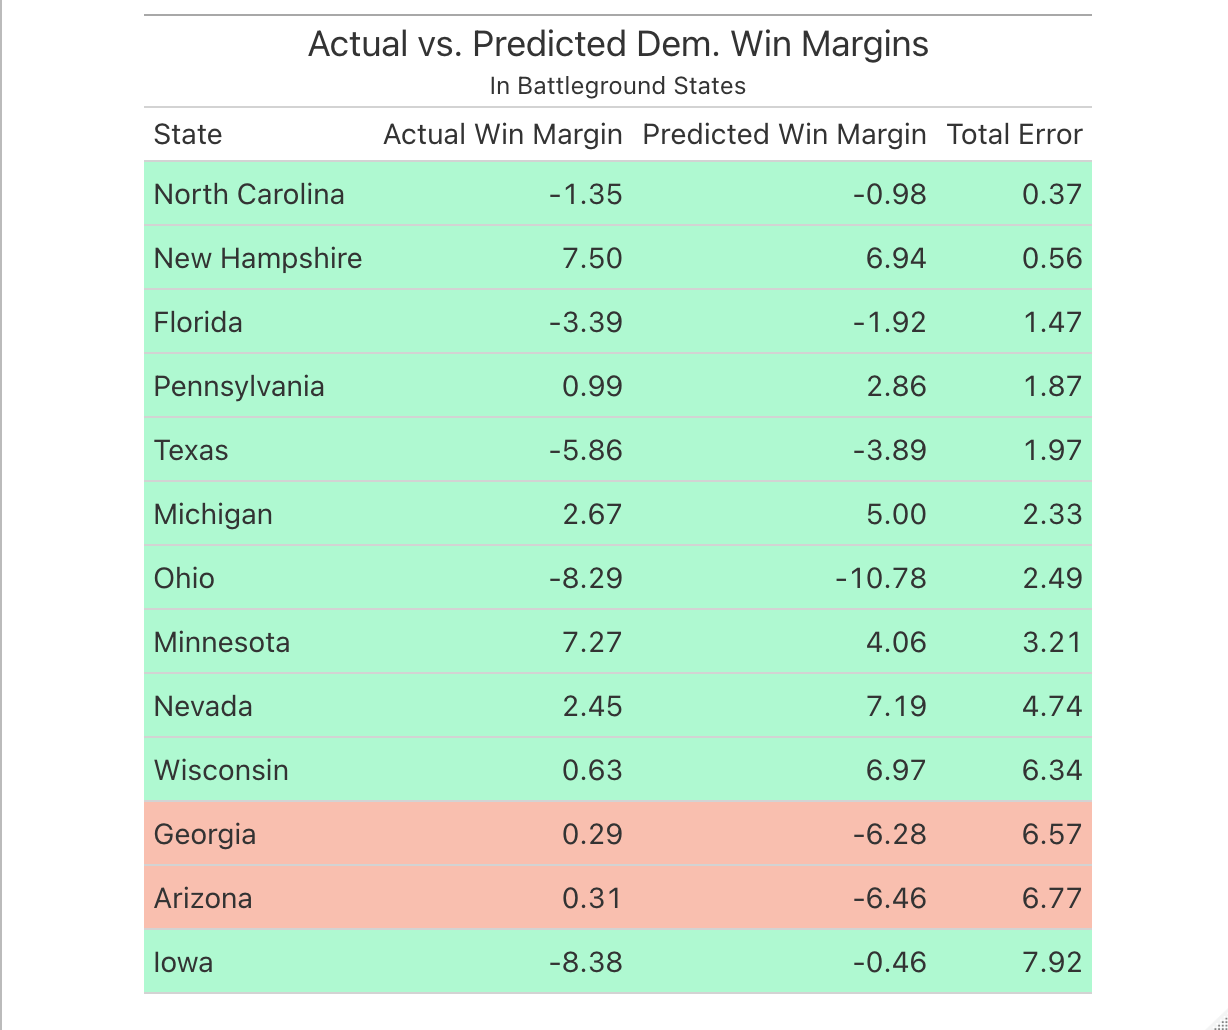
Notably, Georgia and Arizona are two of the three states with the highest total error, the other being the state of Iowa. However, the nature of the error for the Iowa predictions is quite different, as I had predicted that Biden would do much better in the state than he did. In the case of the Arizona and Georgia predictions, I predicted that Biden would do much worse than he actually did. Basically, from the perpsective of my predictions, Biden overperformed in Arizona and Georgia, and my model was not able to predict this (his underperformance in Iowa would be a bigger problem if my model had predicted him to win, but both my prediction and the actual outcome resulted in a Biden loss in the state). But this begs the question: why was my model unable to predict Biden victories in Arizona and Georgia, and what about those states (as compared to other battleground states) made them different from other states that largely followed historical trends in ultimately going for either the Democratic or Republican candidate?
The first element in this puzzle has to do with a shift in the voting behavior of important demographic subgroups in the states of Arizona and Georgia that I was not able to meaningfully capture in my model. One of the reasons why a Democratic presidential candidate was able to win in traditionally Republican states like Arizona and Georgia is due to a massive shift in white, college-educated voters who supported Trump in 2016 but voted for Biden in 2020. College-educated white men in Georgia supported Trump over Biden by a margin of 55 points in 2016, but only supported Trump over Biden by a 12-point margin in 2020, marking a 43 percentage point shift from Trump to Biden. In Arizona, a similar dynamic is at play, with 17 and 15 point shifts towards Biden among college-educated white women and men, respectively. Additionally, the margin of support for Trump over Biden among non-college-educated white men in Arizona shrank by 18 points, which is also a fairly large drop in support among one of his key voting blocs. While my model did try to account for demographic change in each state, there was no way to really capture fairly marked shifts in support for candidates amongst particular demographic subgroups. It’s also worth noting that these shifts in support from Trump to Biden amongst subgroups of white voters also occurred in other swing states I correctly predicted (such as Wisconsin, Pennsylvania, and Michigan), but the historical trend of relatively larger support for Democrats amongst white voters in those states makes those trends less consequential for changing the outcomes in those states.
The other issue that merits discussion is the role of particular minority demographic groups in powering the Democratic wins in Arizona and Georgia. In Arizona, it seems as though support for Biden amongst hispanic voters was key to his slim victory over Trump, and Black voters in Georgia were a huge factor in his ability to flip the state blue after decades of Republican victories and an extremely slim Republican victory in the 2018 gubernatorial election. Though I did use a predictive variable that represented the change in a state’s white population (and inherently, the change in the state’s nonwhite population) in my model, this did not account for changes in specific populations (hispanic & Black populations) that were uniquely important in each state’s respective outcome. Below, see a table that shows the change in the Black, hispanic, and white populations in key battleground states.
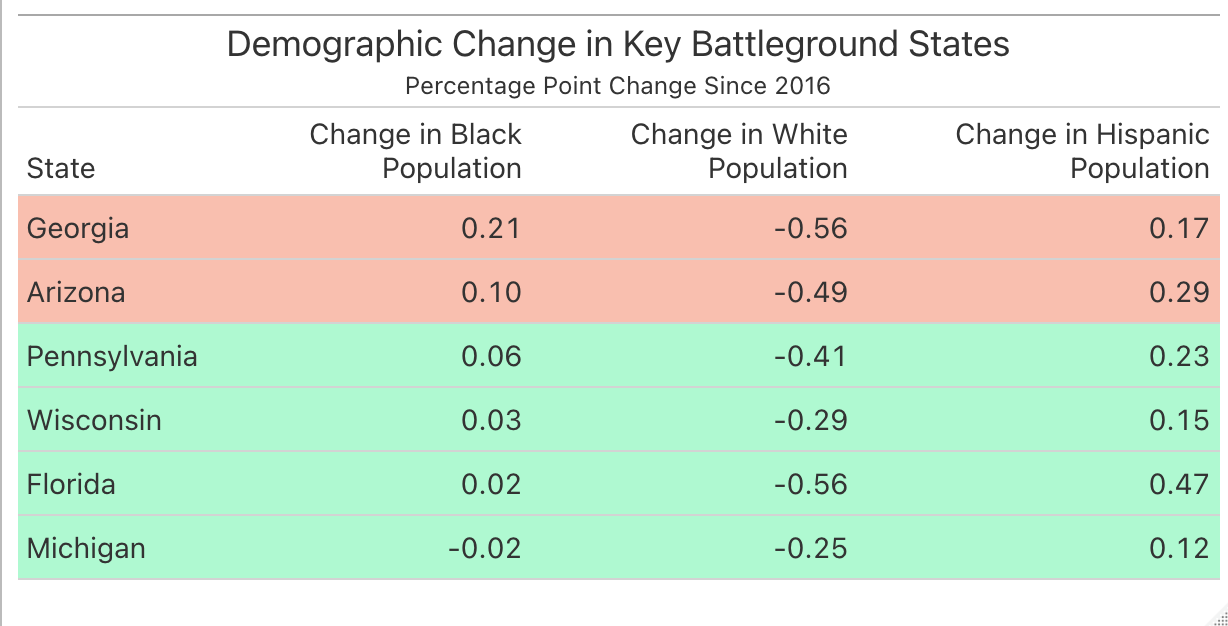
As you can see, Georgia and Arizona had the largest increases in their Black populations, and Arizona had the second-largest increase in its hispanic population after Florida. This seems to suggest that including these variables in some way would have increased the predictive accuracy of my model, but it’s also important to consider the fallacy of constructing a demographic category like “hispanic” and expecting it to be equally predictive across states. As we saw in this election, hispanic voters do not vote as a monolith, and hispanic voters in Florida are very different than hispanic voters in Arizona and probably shouldn’t be grouped together under the same category. Also notice how Georgia and Florida also had the biggest decreases in the white population (and polling right before the election showed narrow Biden leads in both states), but the states ultimately yielded very different outcomes in terms of of which candidate won the election, possibly suggesting that shifts in the white population alone were not quite as predictive as I had initally hoped they would be. This also ties back to my earlier point about shifts in support within white population subgroups in Georgia and Arizona, which wouldn’t be captured based on the change of the white population as a percentage of the overall population. Finally, it’s important to note that the demographic breakdown of a state’s population is probably less meaningful than the demographic breakdown of a state’s registered voters. In Georgia, efforts by grassroots groups to register voters seem to have paid dividends for Democrats, and similar work to organize and register Latino voters in Arizona was a key factor in Biden’s win in that state.
In order to investigate my hypotheses, I would ideally incorporate voter registration data into a revised version of my original model. My first hypothesis is essentially that significant blocs of white voters (who make up the majority of voters in virtually every state) shifted support from Trump to Biden in key swing states like Georgia and Arizona (where historically, white voters are relatively more likely to be Republicans as opposed to other states such as Wisconsin), and adding a variable such as the net percent change in Democratic registered voters in a state could help to more effectively gauge the change in overall partisanship of a state in between elections. Because of the nature of my second hypothesis, which is essentially that certain demographic minority groups played a key role in helping the Democrats “flip” states like Arizona and Georgia, I would want to add a variable that captures the interaction between the change in population of a certain minority demographic group and the net percent change in Democratic registered voters. Logically, it follows that if the Black population in a state like Georgia is increasing at a disproportionate rate to other populations, Black Georgians will disproportionately make up the share of new registered voters, and thus the interaction between the two terms would be the best way of capturing this effect. Ultimately, I would incorporate both these variables into my model and assess their effect on its accuracy by looking at the statistical significance of both coefficients, calculating the change in R-squared and Mean Squared Error (MSE) values across the various regressions used in the new model, and using leave-one-out validation to make a determination about the new model’s out-of-sample fit relative to the existing one. Ultimately, if my model has lower errors in terms of predicting candidate vote shares, lower MSE, and a higher R-squared value, then I could probably take that as evidence that my model would have benefitted from the inclusion of voter registration data or some sort of proxy for temporally recent shifts in the political & demographic landscape of a state.
Next Time Around…
What would I change about my model if I had to do it again? Here’s a few ideas:
1) I would incorporate data from midterm elections into my model’s design in some capacity. While it may not be the case that midterm elections are generally good predictors of upcoming presidential elections (in fact, evidence seems to point to the fact that midterms are a reflection on the incumbent candidate’s performance in office), the results of the 2018 elections generally forecasted shifting partisan “leans” in key swing states like Wisconsin, Michigan, Georgia, and Arizona. Democratic wins in gubernatorial races in Wisconsin and Michigan suggested that those states were not necessarily going to continue on a trajectory of becoming more Republican after surprising Trump victories there in 2016, and the victory of a Democratic Senate candidate in Arizona for the first time since the 1980s suggested the possibility of “flipping” the state blue. Additionally, a very small margin of victory for the Republican candidate in the 2018 Georgia gubernatorial election suggested that the Democrats were within reach of winning the state in the coming years. It may not necessarily be helpful to use midterm data as a predictive variable, but perhaps using the results of the 2018 midterms as a way to pool swing states that are on a similar political trajectory together would have yielded a stronger model.
2) I would experiment with models that involve some degree of pooling. While my unpooled model was actually fairly accurate (especially as compared to my completely pooled model, which predicted a huge Biden victory based off of national trends that showed a decisive lead in the presidential election), it did seem to rely too much on historical partisan leans of states and discounted contemporary trends. For example, Georgia and Arizona have pretty solid histories of voting for Republicans for the past few decades, so it makes sense that an unpooled model (where each state’s prediction is being made using only historical data from that state) would overestimate how the Republican candidate would fare in those states. I’m not exactly sure what kind of pooling would be the most accurate (pooling red, blue, and swing states together? pooling demographically similar states together?), but it seems like the choice of using a completely unpooled model hurt my predictions in states that have, politically, changed immensely in the past half-decade or so.
3) I would want to incorporate some metric that serves as a proxy for political enthusiasm in between presidential elections, such as the net percent change in Democratic registered voters. As I previously alluded to, shifts in support away from Trump in key swing states during the 2020 election were very important, but were not really captured in my model (and this effect was only heightened by the nature of my model being unpooled). Thus, including the net percent change in Democratic registered voters would serve as a way for my model to gauge the short-term shifts in the political landscape that can ultimately be very definitive in extremely close elections.
4) Finally, I would adjust my model to yield actual predictions for DC and the NE and ME congressional district electoral votes. Based on the lack of availability of certain data, I automatically assigned DC to Biden (as DC has voted for the Democrat in every election going back decades) and the NE and ME congressional district electoral votes to the winners of each state. While these decisions did not ultimately have an impact on the accuracy of my prediction overall, I would ideally be able to generate predicted vote shares for the Democratic and Republican candidate in each jurisdiction.